Conclusion For Revamp
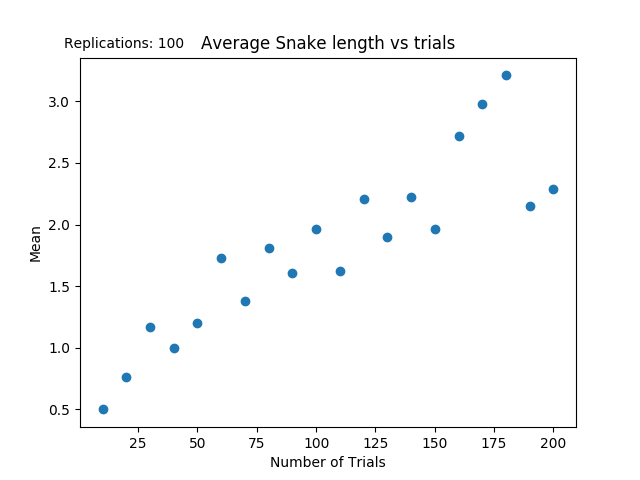
After training the snake under the same parameters as before, the results look like the following.

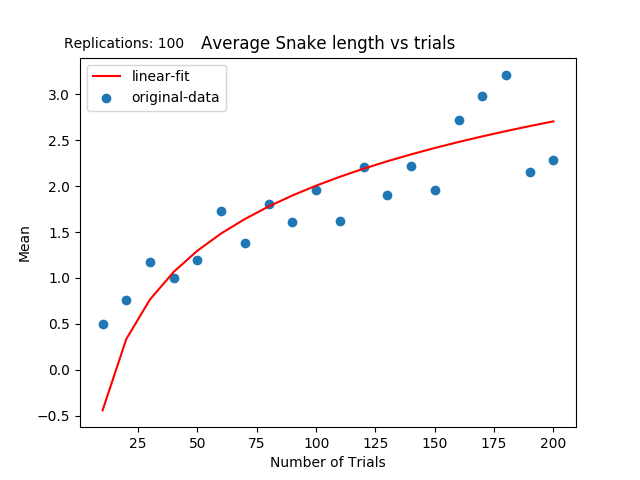
If we undergo the same transofrmations then we will end up with the following graph.

This graph looks very similar to the other graph that appeared logarithmic. The interesting things to note are the very low scores that the snake achieved compared to the previous version of the game. Interesting future work would be to see if the dropoff could be mitigated by changing the state encoding or the reward function.
What is impoortant to see is that the line of best fit through the logarithmic regression is still a logarithmic line. The R squared value is .66 which indicates that the line is a good approximation of the given data.